This will be the third ‘ Gold Whispering’ commentary I have penned, (see Dec 2023 and Jan 2025).
All the data below is drawn from the St Louis Federal Reserve. I am using closing prices on December 31, 2025. The commentary begins by examining the bear case for Gold and then offers a single reason to remain bullish.Calculating the purchasing power of Gold in other commodities is a simple exercise. If Gold is trading at $2,000 an ounce and Oil (WTI) is trading at $100 a barrel, we can say that an ounce of Gold is worth 20 barrels of Oil. This ratio or purchasing power will vary overtime. From the chart below we can see since 1970 an ounce of Gold was worth as few as 7 barrels of Oil and as many as 102 barrels.
We cannot know what the fair or correct exchange rate between Gold and Oil should be. But we can figure out the median or middle level. In this case, between January 1970 and December 2025, 16 barrels represents the median. In other words, half of the time the Gold/Oil exchange rate traded above 16 and half of the time below 16.
Take a look at the chart below. Each green bar below represents the number of barrels of Oil an ounce of Gold can buy. These ratios are based on monthly average prices for both Gold and Oil (WTI Oil).
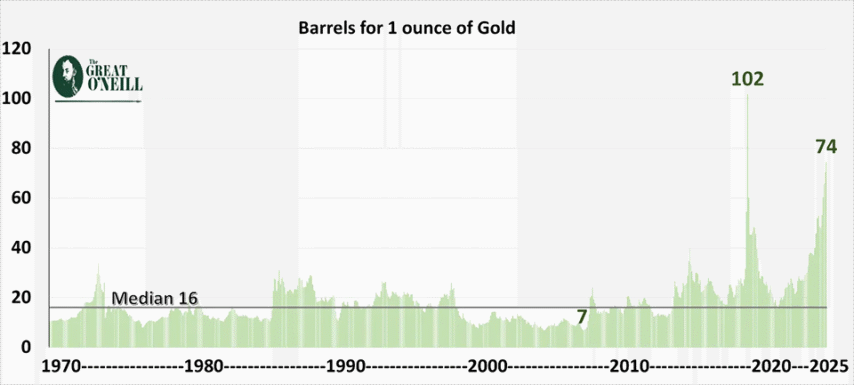
We can see in 2008 when the Oil rallied sharply to over $130 per barrel, an ounce of Gold could only buy 7 barrels of Oil. The collapse of Oil prices in 2020 increased Gold’s purchasing power to 102 barrels. We can describe these Gold / Oil exchange rates using percentiles as follows:
Lowest Exchange Rate – 7 Barrels – 0% Percentile
Median Exchange Rate – 16 Barrels – 50thpercentile. (50%)
Highest Exchange Rate – 102 Barrels – 100thpercentile. (100%)
The last price on the chart is the exchange rate on Jan 1 2026 – 74 Barrels. This rate is the 99thpercentile. To be exact, the Gold/Oil exchange rate has been lower than 74 barrels 99.8% of the time since 1970. It is pretty plain to see that Gold is trading strongly against Oil today. This percentile number is really the key data point. It tells us how cheap or expensive Gold versus Oil is.
Now that we have established that Gold is trading at the 99thpercentile versus Oil we can repeat the exercise for other commodities. Using the same parameters as in the Oil chart above, the chart below cuts to the chase. Each bar below represents the percentile for Gold against various commodities including Oil on January 1 2026. Due to data constraints, this data only goes back to 1990.
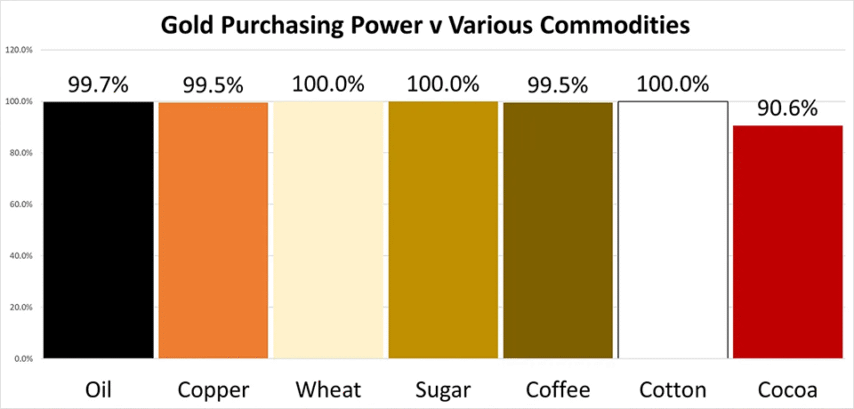
Clearly, with the exception of Cocoa, Gold looks rich against this selection of commodities. Furthermore, in terms of the US Dollar, it is close to lifetime highs ($4315). But this is not the whole story. We can learn a lot more by comparing Gold to the money (Dollar) supply.
Measuring the purchasing power of Gold versus the supply of money is a trickier prospect. The supply of money does not have a price. It is a quantity. In theory at least, as the quantity of money in circulation grows the price of Gold should adjust higher.
The St. Louis Federal reserve bank gives us a measure of money supply called M2 for the United States. This is a measure of the total amount of cash, current and deposit accounts and some money market instruments in existence. We can use this number as a proxy for the growth in the total amount of Dollars in existence over the years.
The next chart is a ratio or exchange rate. It shows us how many 10-ounce Gold bars it would take to match the money supply in the United States. I have used the higher metric (10 ounces) for Gold in this analysis. It makes the charting a little easier on the eye. The data is monthly averages. Each green column represents the number (in millions) of 10-ounce bars that it takes to match the money supply.
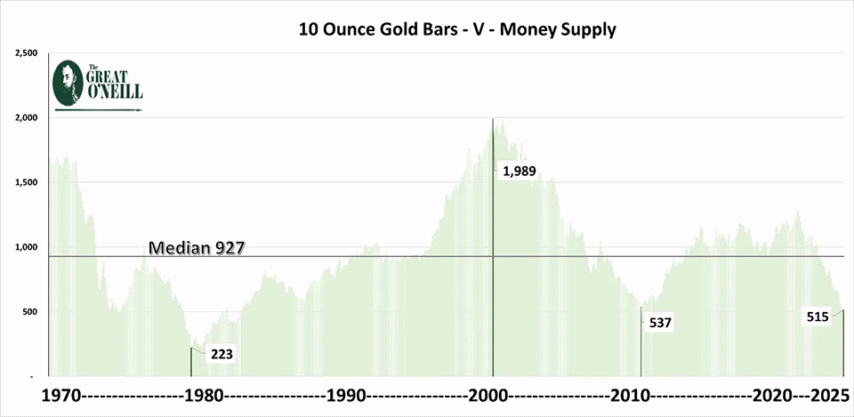
For clarity, let us take a look at some percentiles. I am describing these percentiles in terms of Gold’s strength or weakness against the supply of Dollars (M2). For example, when Gold was trading at $260 in 2001 it was at its weakest ‘exchange rate’ to money supply – 1,989m 10 ounce bars.
Lowest (weakest) Gold Exchange Rate – 1989m – 0% Percentile
Median Gold Exchange Rate – 927m – 50thpercentile. (50%)
Highest (strongest) Gold Exchange Rate – 233m – 100thpercentile. (100%)
Today (Jan 1 2026) it takes 515m bars to match Dollar supply(M2). 515 bars is the 92nd percentile. To match its strongest ever ratio (223) it would need to reach $10,000 per ounce.
Is It Time To Sell Gold?
All of the above charts should serve as a warning shot across the bows for the most ardent Gold bugs. Gold is at close to lifetime highs ($4,315). It is high against money supply (92nd percentile) and indeed against most other commodities. All of this is bad news for natural Gold bugs like the Great O’Neill. There are fewer obvious reasons to be long Gold and many good reasons to liquidate long positions. Prices and price ratios do have a tendency to swing back and forth around the 50th percentile. This would suggest that Gold should swing back from its high percentiles versus money supply and some of the aforementioned commodities, Oil, wheat and sugar etc.
Will Gold Ratios Revert to Median?
To revert to median against the money supply, (towards the 50th percentile; 927), Gold would need to drop in price or money supply would need to increase. We can be reasonably confident that money supply will increase: after all that is how fiat currency systems work. A simple,(and almost natural), 5% increase in M2 money supply next year will reduce the Gold/ Money supply ratio by 2 percentiles. Given that money supply is doubling every 10 years it is easy to see how the Gold /M2 ratio could ‘normalize’ towards the 50th percentile gradually without a significant move in the price of Gold.
For Gold ratios to regress to the 50th percentile against other commodities we either need Gold to drop in price or Oil, Copper, Wheat, Sugar, Coffee, Cotton and Cocoa to increase in price. This is a different matter altogether. At half its present price, ($4,315 divided by 2), Gold would still be in the mid nineties percentiles against Oil, Wheat, Sugar and Cotton. See the chart below.

Another way to look at it is: how much would other commodities need to rally to ‘normalize’ the present high Gold price? Using the 50th percentile as a target we would need the following prices:
Oil $58 –> $250
Copper $5.7 –> $10.6
Wheat $5 –> $33
Sugar $15 –>$74
Coffee $3.5 –> $7.4
Cotton $7.8 –> $40
Cocoa $6,000 –>$12,500
I appreciate that all of this data is a little head wrecking! No data point that I have given gives a particularly great insight. But taken as a whole this analysis helps to illuminate the magnitude and breath of the recent Gold rally. Gold has rallied enormously against an impressive array of metrics.
It seems there are many reasons to sell Gold. But there is only one reason to buy.
The Long and Winding Road to Hyperinflation.
The final rejection of a fiat currency is generally chaotic and very destructive. This is often called hyperinflation or currency collapse. Although the road leading to hyperinflation can be long and winding there are signposts along the way that can tell how close we are to a hyperinflationary singularity. It might be useful to review our hyperinflationary road trip from the beginning, through the middle and towards the cataclysmic end.
The Beginning
The first sign that hyperinflation is on its way is huge; although we are blind to it. Like a huge motorway spanning billboard it screams.
This sign actually states two things. First, governments are unable to fund their spending from taxation. Second, government is politically compelled to borrow. It is important to understand that inflation and its hyper variants are always a political construct. The government and many times the political system itself is unable to survive a reversal of continuous borrowing. It matters not a jot whether it is a leftwing, right wing, democratic, or totalitarian government. Once a society gets hooked on continuous money creation; withdrawal can be intolerable. Ergo deficit spending (borrowing to spend) is almost impossible to stop voluntarily. This becomes normalized in society. The general public hardly notices, for them it is natural for prices to rise over years as the purchasing power of their money decreases.
The Middle – Slow Disintegration
Fiat currencies allow governments to grow to gargantuan scales. So much so that aside from those directly employed by governments entire industries have become largely dependent on government largess and favourable legislation. Huge government departments hand out favours and contracts in every part of the economic system, from healthcare, pharma, arms manufacturing, education, tourism, environment, TV, radio, and thousands of NGOs. It is an almost endless list. No corner of life is untouched by government.
Our capital cities have become cesspits of lobbying and jockeying for position. It becomes apparent that the easiest way to gain wealth is to plug in to government somehow. It is the same play every time; exaggerate or create a problem. Propose a government financed solution. Remember that for every perceived problem somebody somewhere is making money out of the government program to solve that problem. The problem solvers are usually the most focal in highlighting (or promoting) the crisis in _________________ (fill in the blank).
Ordinary citizens tend to move away from traditional work involving the production of useful products and services. More people are working in non-productive government or government adjacent jobs. Universities produce a higher proportion of uneducated and non-thinking people than before. There is an increased predilection for gambling in capital markets. The quick buck or hustle seems a better prospect than the slow and steady wage.
During the declining years of the Roman Empire, the city of Rome itself resembled a modern day Las Vegas. It was a long way removed from its earlier image as a bastion of power and order. I think we can see echoes of this transition in our modern capitals today.
The End – Confusion and Chaos
I don’t see any hyper-inflationary chaos now. But there is confusion aplenty. I have written about this many times before, (the event horizon et al). A heavy fog of confusion engulfs the investment landscape as seemingly solid stocks become moribund in a quagmire of uncertainty while stocks with the flimsiest business plans soar in value. Bankrupt first world nations are somehow able to borrow money from the private sector. They will spend a proportion of these borrowed funds on their present debt repayment schedules and repeat the process year after year as the indebtedness grows in plain view.

It is certainly confusing and seemingly endless. But not chaotic. Yet.
What is Gold Whispering About Hyperinflation
A hyper-inflationary event is when sellers refuse to take a fiat currency as payment. Although we are not experiencing hyperinflation now, we are certainly on the hyper-inflationary road. Like the speed dial in your car, the rapidly increasing Gold price says we are accelerating.
There are no exits on this road.
The Great O’Neill is a Commodity Trading Advisor who writes a regular blog here